Genetic value#
This page will describe how to simulate genetic values by using genetic_value() function. Genetic
values of individuals are described by \(X\beta\), where \(X\) is the matrix that describes
the number of causal alleles in each individual and \(\beta\) is the vector of effect sizes. See
Phenotype Model for mathematical details on the quantitative trait model.
Learning Objectives
After this genetic value page, you will be able to:
Understand how to generate genetic value in tstrait
Understand how to use the user’s defined effect sizes to generate genetic values
Algorithm Overview#
Genetic value is computed in tstrait by using the trait information in the input trait dataframe. It uses a tree traversal algorithm to count the number of causal allele in each individual and adds the corresponding effect size to individual’s genetic value.
Input#
The input of genetic_value() function is the following:
- ts
Tree sequence input.
- trait_df
Trait dataframe that is described in Effect Size Simulation. There are some requirements for the trait dataframe input, which are described in Dataframe requirements.
The details of the parameters and how they influence the genetic value simulation are described in detail below.
Genetic value computation#
In this example, we will be showing how to compute genetic values by using the simulated trait dataframe
in genetic_value().
We will be simulating a sample tree sequence data with 5 individuals by using msprime,
and we will simulate a trait dataframe with 3 causal sites. The dataframe output of sim_trait()
can be automatically used as an input of genetic_value(), so there is no need to worry about input
data requirements.
data requirements.
See also
msprime for simulating whole genome in tree sequence data.
Trait simulation for simulating trait dataframe in tstrait.
import msprime
import tstrait

ts = msprime.sim_ancestry(
    samples=5,
    recombination_rate=1e-8,
    sequence_length=100_000,
    population_size=10_000,
    random_seed=100,
)
ts = msprime.sim_mutations(ts, rate=1e-8, random_seed=101)
model = tstrait.trait_model(distribution="normal", mean=0, var=1)
trait_df = tstrait.sim_trait(ts, num_causal=3, model=model, random_seed=5)
trait_df
| position | site_id | effect_size | causal_allele | allele_freq | trait_id | |
|---|---|---|---|---|---|---|
| 0 | 1901 | 3 | 0.420445 | G | 0.2 | 0 |
| 1 | 69303 | 89 | 1.136047 | G | 0.6 | 0 |
| 2 | 82287 | 107 | 0.109706 | A | 0.1 | 0 |
Please refer to Effect Size Simulation for details on the trait dataframe output and effect size
simulation by using sim_trait().
Next, we will be using the trait dataframe to generate genetic values by using genetic_value().
genetic_df = tstrait.genetic_value(ts, trait_df)
genetic_df
| trait_id | individual_id | genetic_value | |
|---|---|---|---|
| 0 | 0 | 0 | 2.692538 |
| 1 | 0 | 1 | 2.381799 |
| 2 | 0 | 2 | 0.420445 |
| 3 | 0 | 3 | 1.136047 |
| 4 | 0 | 4 | 1.136047 |
The output of genetic_value() is a pandas.DataFrame object that describes
the genetic values of individuals.
The genetic value dataframe includes the following columns:
trait_id: Trait ID that will be used in multi-trait simulation.
individual_id: Individual ID inside the tree sequence input.
genetic_value: Simulated genetic values.
User defined trait dataframe#
We will be demonstrating how to simulate genetic values from a user defined trait dataframe.
Dataframe requirements#
There are some requirements for the trait dataframe input:
Columns#
The following columns must be included in trait_df:
site_id: Site IDs that have causal allele.
effect_size: Simulated effect size of causal allele.
causal_allele: Causal allele.
trait_id: Trait ID.
Note
The IDs in the trait_id column must start from 0 and be a consecutive integer. The IDs in the site_id column must be non-decreasing.
If you are simulating single traits, trait_id must be an array of zeros. The method
pandas.DataFrame.sort_values() can be used to sort the dataframe based on site_id.
Data requirements#
Site IDs in site_id column must be sorted in an ascending order. Please refer to
pandas.DataFrame.sort_values()for details on sorting values in apandas.DataFrame.Trait IDs in trait_id column must start from zero and be consecutive.
We will be demonstrating how to simulate genetic values with 1 causal site.
import pandas as pd

data = {"site_id": [0], "effect_size": [1], "trait_id": [0],
        "causal_allele": ["1"]}
trait_df = pd.DataFrame(data)
trait_df
| site_id | effect_size | trait_id | causal_allele | |
|---|---|---|---|---|
| 0 | 0 | 1 | 0 | 1 |
ts = msprime.sim_ancestry(
    samples=5,
    recombination_rate=1e-8,
    sequence_length=100_000,
    population_size=10_000,
    random_seed=100,
)
ts = msprime.sim_mutations(ts, rate=1e-6, model="binary", random_seed=10)
genetic_df = tstrait.genetic_value(ts, trait_df)
genetic_df
| trait_id | individual_id | genetic_value | |
|---|---|---|---|
| 0 | 0 | 0 | 0.0 |
| 1 | 0 | 1 | 1.0 |
| 2 | 0 | 2 | 0.0 |
| 3 | 0 | 3 | 0.0 |
| 4 | 0 | 4 | 0.0 |
As seen in the genetic value dataframe, the genetic values of individuals are multiples
of 1. This is because 1 is the only effect size in the effect size dataframe, and the
genetic_value() function is counting the number of causal alleles of site 0
inside the individual.
Next, we will be inputting an effect size dataframe with multiple causal sites.
data = {"site_id": [0, 2, 4], "effect_size": [1, 10, 100],
        "causal_allele": ["1", "1", "1"], "trait_id": [0, 0, 0]}
trait_df = pd.DataFrame(data)
trait_df = trait_df.sort_values(by=["site_id"])
trait_df
| site_id | effect_size | causal_allele | trait_id | |
|---|---|---|---|---|
| 0 | 0 | 1 | 1 | 0 |
| 1 | 2 | 10 | 1 | 0 |
| 2 | 4 | 100 | 1 | 0 |
The site IDs in "site_id" column in the trait dataframe must be sorted in an
ascending order, so it is suggested to use .sort_values(by=['site_id'])
code before inputting it inside the genetic_value() function.
genetic_df = tstrait.genetic_value(ts, trait_df)
genetic_df.head()
| trait_id | individual_id | genetic_value | |
|---|---|---|---|
| 0 | 0 | 0 | 0.0 |
| 1 | 0 | 1 | 1.0 |
| 2 | 0 | 2 | 10.0 |
| 3 | 0 | 3 | 100.0 |
| 4 | 0 | 4 | 0.0 |
Numericalisation of Genotypes#
The genotypes are numericalised as the number of causal alleles in each individual (Please see Phenotype Model for mathematical details on the phenotype model), but it would be possible to change the numericalisation by modifying the genetic value dataframe based on the effect size dataframe. For example, in the diploid setting, if you are interested in simulating phenotypes from the genotype \((aa=-1, Aa=0, AA=1)\), where \(A\) is the causal allele, we can simply subtract the sum of effect sizes from the genetic value.
In the following, we will provide a quick example on how genetic values are being computed
based on the mutation information and effect sizes. We will assume that the A allele
represents the causal allele in site 1 and the B allele represents the causal allele in
site 2. The effect sizes will be encoded as \(\beta_1\) and \(\beta_2\) for sites 1 and 2,
respectively. The genotype and genetic value of individuals based on the tstrait’s
numericalisation of genotypes \((aa=0, Aa=1, AA=2)\) are shown in the table below:
Individual ID |
Site 1 |
Site 2 |
Genetic Value |
|---|---|---|---|
1 |
Aa |
BB |
\(\beta_1+2\beta_2\) |
2 |
aa |
Bb |
\(\beta_2\) |
If we modify the numericalisation of genotypes to be \((aa=-1, Aa=0, AA=1)\), we get the following:
Individual ID |
Site 1 |
Site 2 |
Genetic Value |
|---|---|---|---|
1 |
Aa |
BB |
\(\beta_2\) |
2 |
aa |
Bb |
\(-\beta_1\) |
When we compare these outputs, we see that the genetic value of individuals in the new encoding \((aa=-1, Aa=0, AA=1)\) is obtained by subtracting the sum of effect sizes \((\beta_1+\beta_2)\) from the original genetic value.
This can be done in the following example:
trait_df = tstrait.sim_trait(ts, num_causal=3, model=model, random_seed=5)
genetic_df = tstrait.genetic_value(ts, trait_df)

# The original dataframe
genetic_df.head()
| trait_id | individual_id | genetic_value | |
|---|---|---|---|
| 0 | 0 | 0 | 0.639858 |
| 1 | 0 | 1 | 1.976937 |
| 2 | 0 | 2 | 2.802245 |
| 3 | 0 | 3 | 3.112984 |
| 4 | 0 | 4 | 3.222690 |
genetic_df["genetic_value"] = genetic_df["genetic_value"] - trait_df["effect_size"].sum()
# New dataframe
genetic_df.head()
| trait_id | individual_id | genetic_value | |
|---|---|---|---|
| 0 | 0 | 0 | -1.026340 |
| 1 | 0 | 1 | 0.310739 |
| 2 | 0 | 2 | 1.136047 |
| 3 | 0 | 3 | 1.446785 |
| 4 | 0 | 4 | 1.556492 |
The new genetic value dataframe can be used in sim_env() to simulate phenotypes.
Normalise Genetic Value#
The computed genetic values can be scaled by using the normalise_genetic_value() function. The function
will first normalise the genetic value by subtracting the mean of the input genetic value and divide it
by the standard devitation of the input genetic value.
Afterwards, it scales the normalised genetic value based on the mean and variance input.
The output of normalise_genetic_value() is a pandas.DataFrame object with the scaled genetic values.
It is suggested to use this function on the genetic value dataframe that is obtained by
genetic_value(), and use the normalised genetic value dataframe to simulate phenotypes
by using sim_env().
An example usage of this function is shown below:
mean = 0
var = 1
ts = msprime.sim_ancestry(
    samples=10_000,
    recombination_rate=1e-8,
    sequence_length=100_000,
    population_size=10_000,
    random_seed=1000,
)
ts = msprime.sim_mutations(ts, rate=1e-7, random_seed=1001)
trait_df = tstrait.sim_trait(ts, num_causal=1000, model=model, random_seed=500)
genetic_df = tstrait.genetic_value(ts, trait_df)
normalised_df = tstrait.normalise_genetic_value(genetic_df, mean=mean, var=var)
normalised_df.head()
| individual_id | trait_id | genetic_value | |
|---|---|---|---|
| 0 | 0 | 0 | 0.651249 |
| 1 | 1 | 0 | -0.530608 |
| 2 | 2 | 0 | 0.534444 |
| 3 | 3 | 0 | -0.637727 |
| 4 | 4 | 0 | -1.807479 |
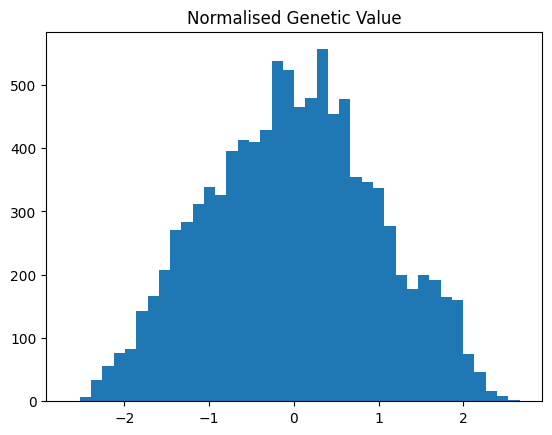
The distribution of the normalised genetic value is shown below, and wee that the mean and variance of the normalised genetic values are 0 and 1.
import matplotlib.pyplot as plt
plt.hist(normalised_df["genetic_value"], bins=40)
plt.title("Normalised Genetic Value")
plt.show()