Edges page#
An edge represents the relationship between a pair of nodes (parent, child) in an ARG over time (assigning the node occurring in more recent time as the child).
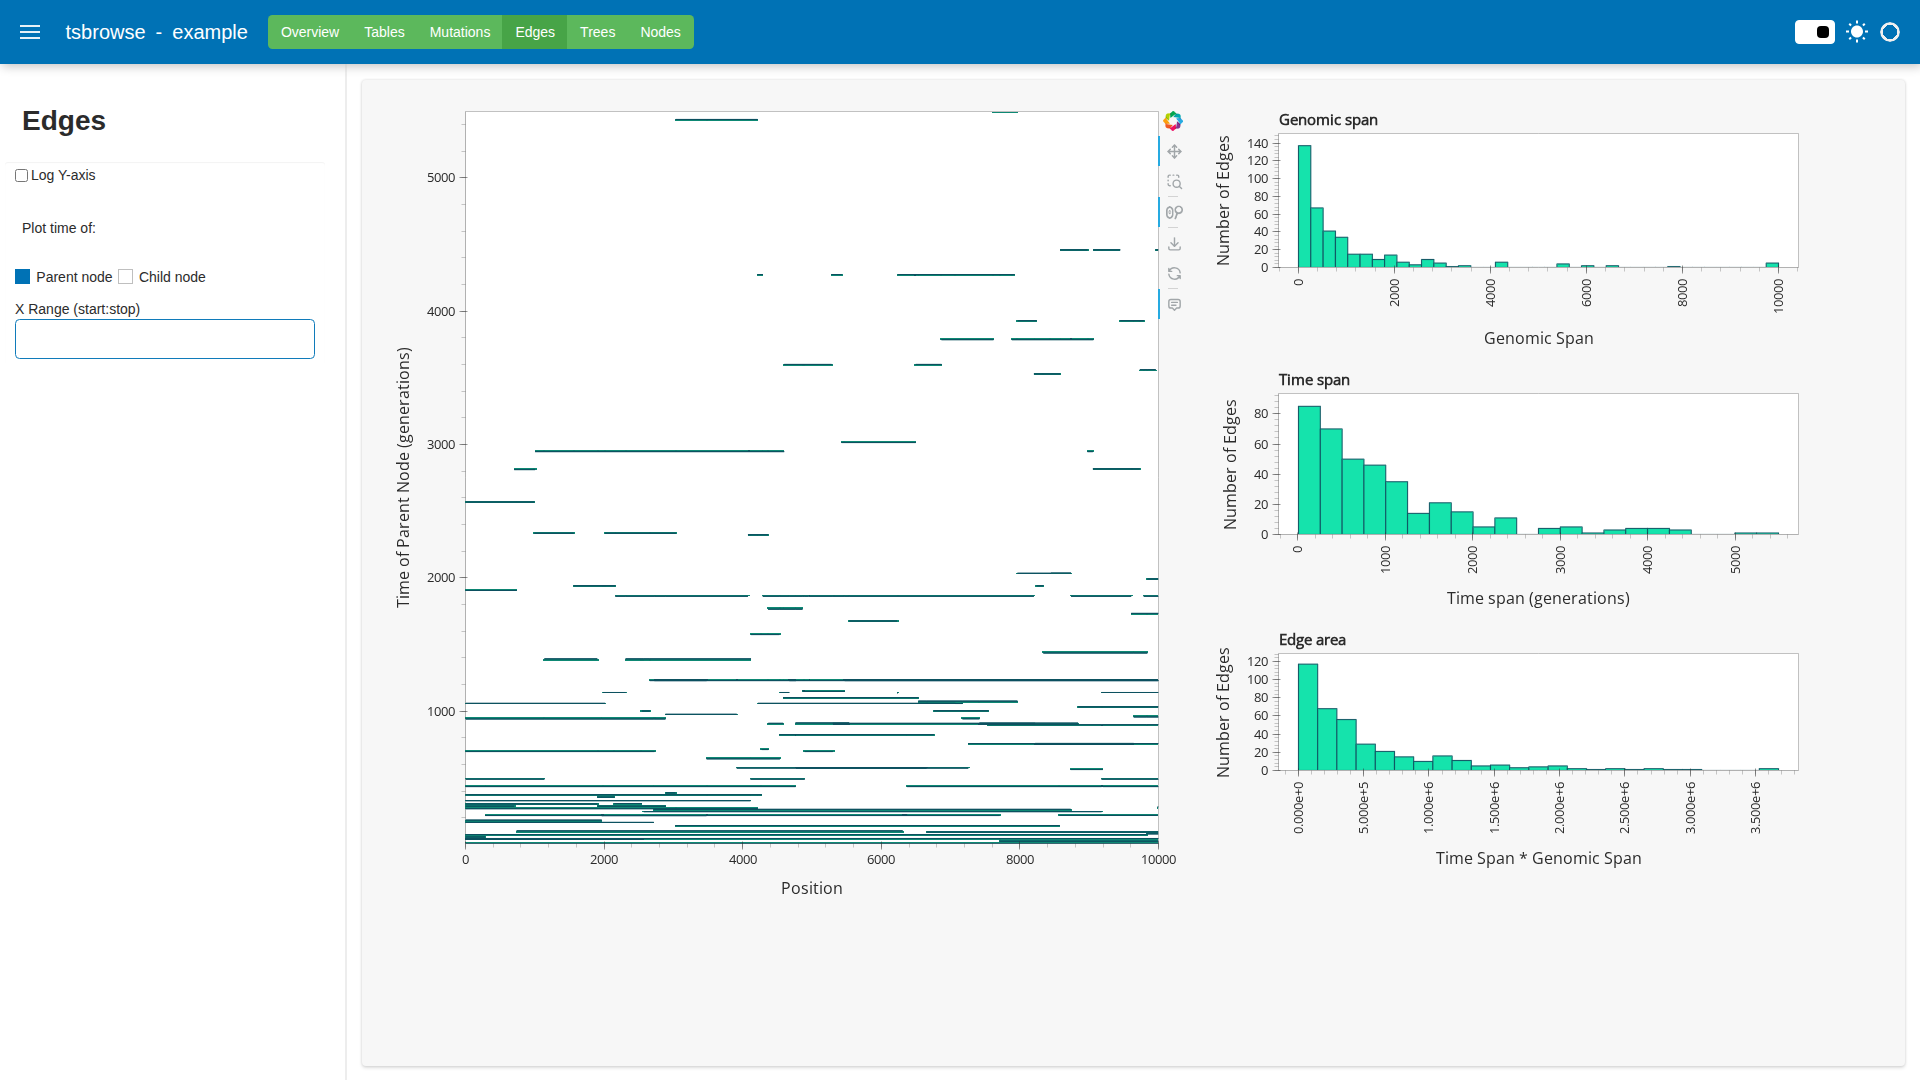
The interactive plot on the top row allows us to visualise these relationships as horizontal lines denoting the length of the edge on the sequence (X-axis) and time of one of the nodes (Y-axis). On mouse-over of an individual edge, the tool-tip displays the parent and child node IDs, length of sequence the edge spans, and the amount of time it spans (branch length).
The bottom panel contains three static histograms which, left to right, summarise the span of edges over the sequence, the span of edges over time (branch lengths), and the product of the two spans.