Mutations page#
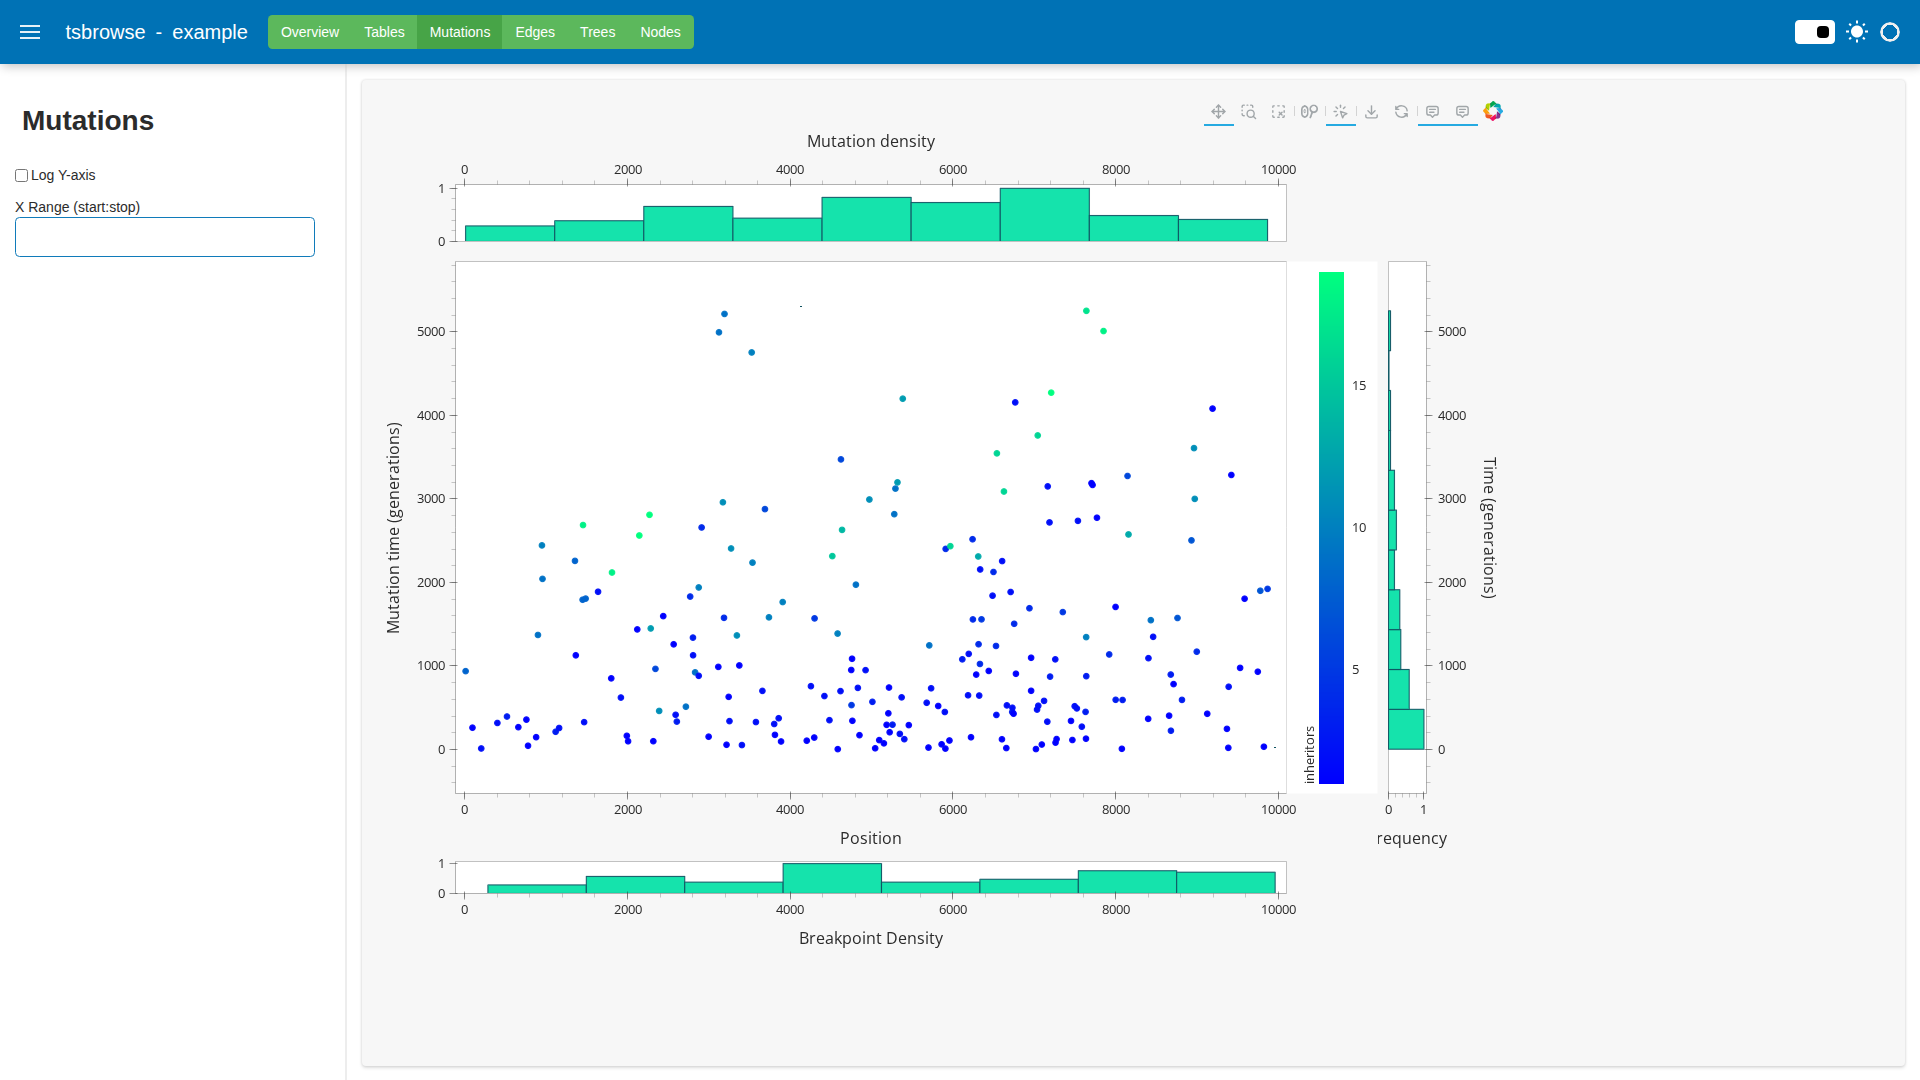
This page plots the mutations on a 2D plot of time and genomic position, coloured by the number of inheritors. The surrounding histograms then give mutation density in time and space, along with breakpoint density. As there are often more mutations than can be displayed in a performant way, the plot summarises the data on a discrete grid when there are more than 1000 mutations in the view. Zooming in (using the mouse wheel or top right controls) will show the individual mutations. Once the individual mutations are displayed, hovering over one will show a tooltip with more information about the mutation. Clicking the mutation will open a popup window with the population frequency of the mutation, along with its full data. This popup can be moved around by dragging its title bar, and closed by clicking whitespace on the plot.